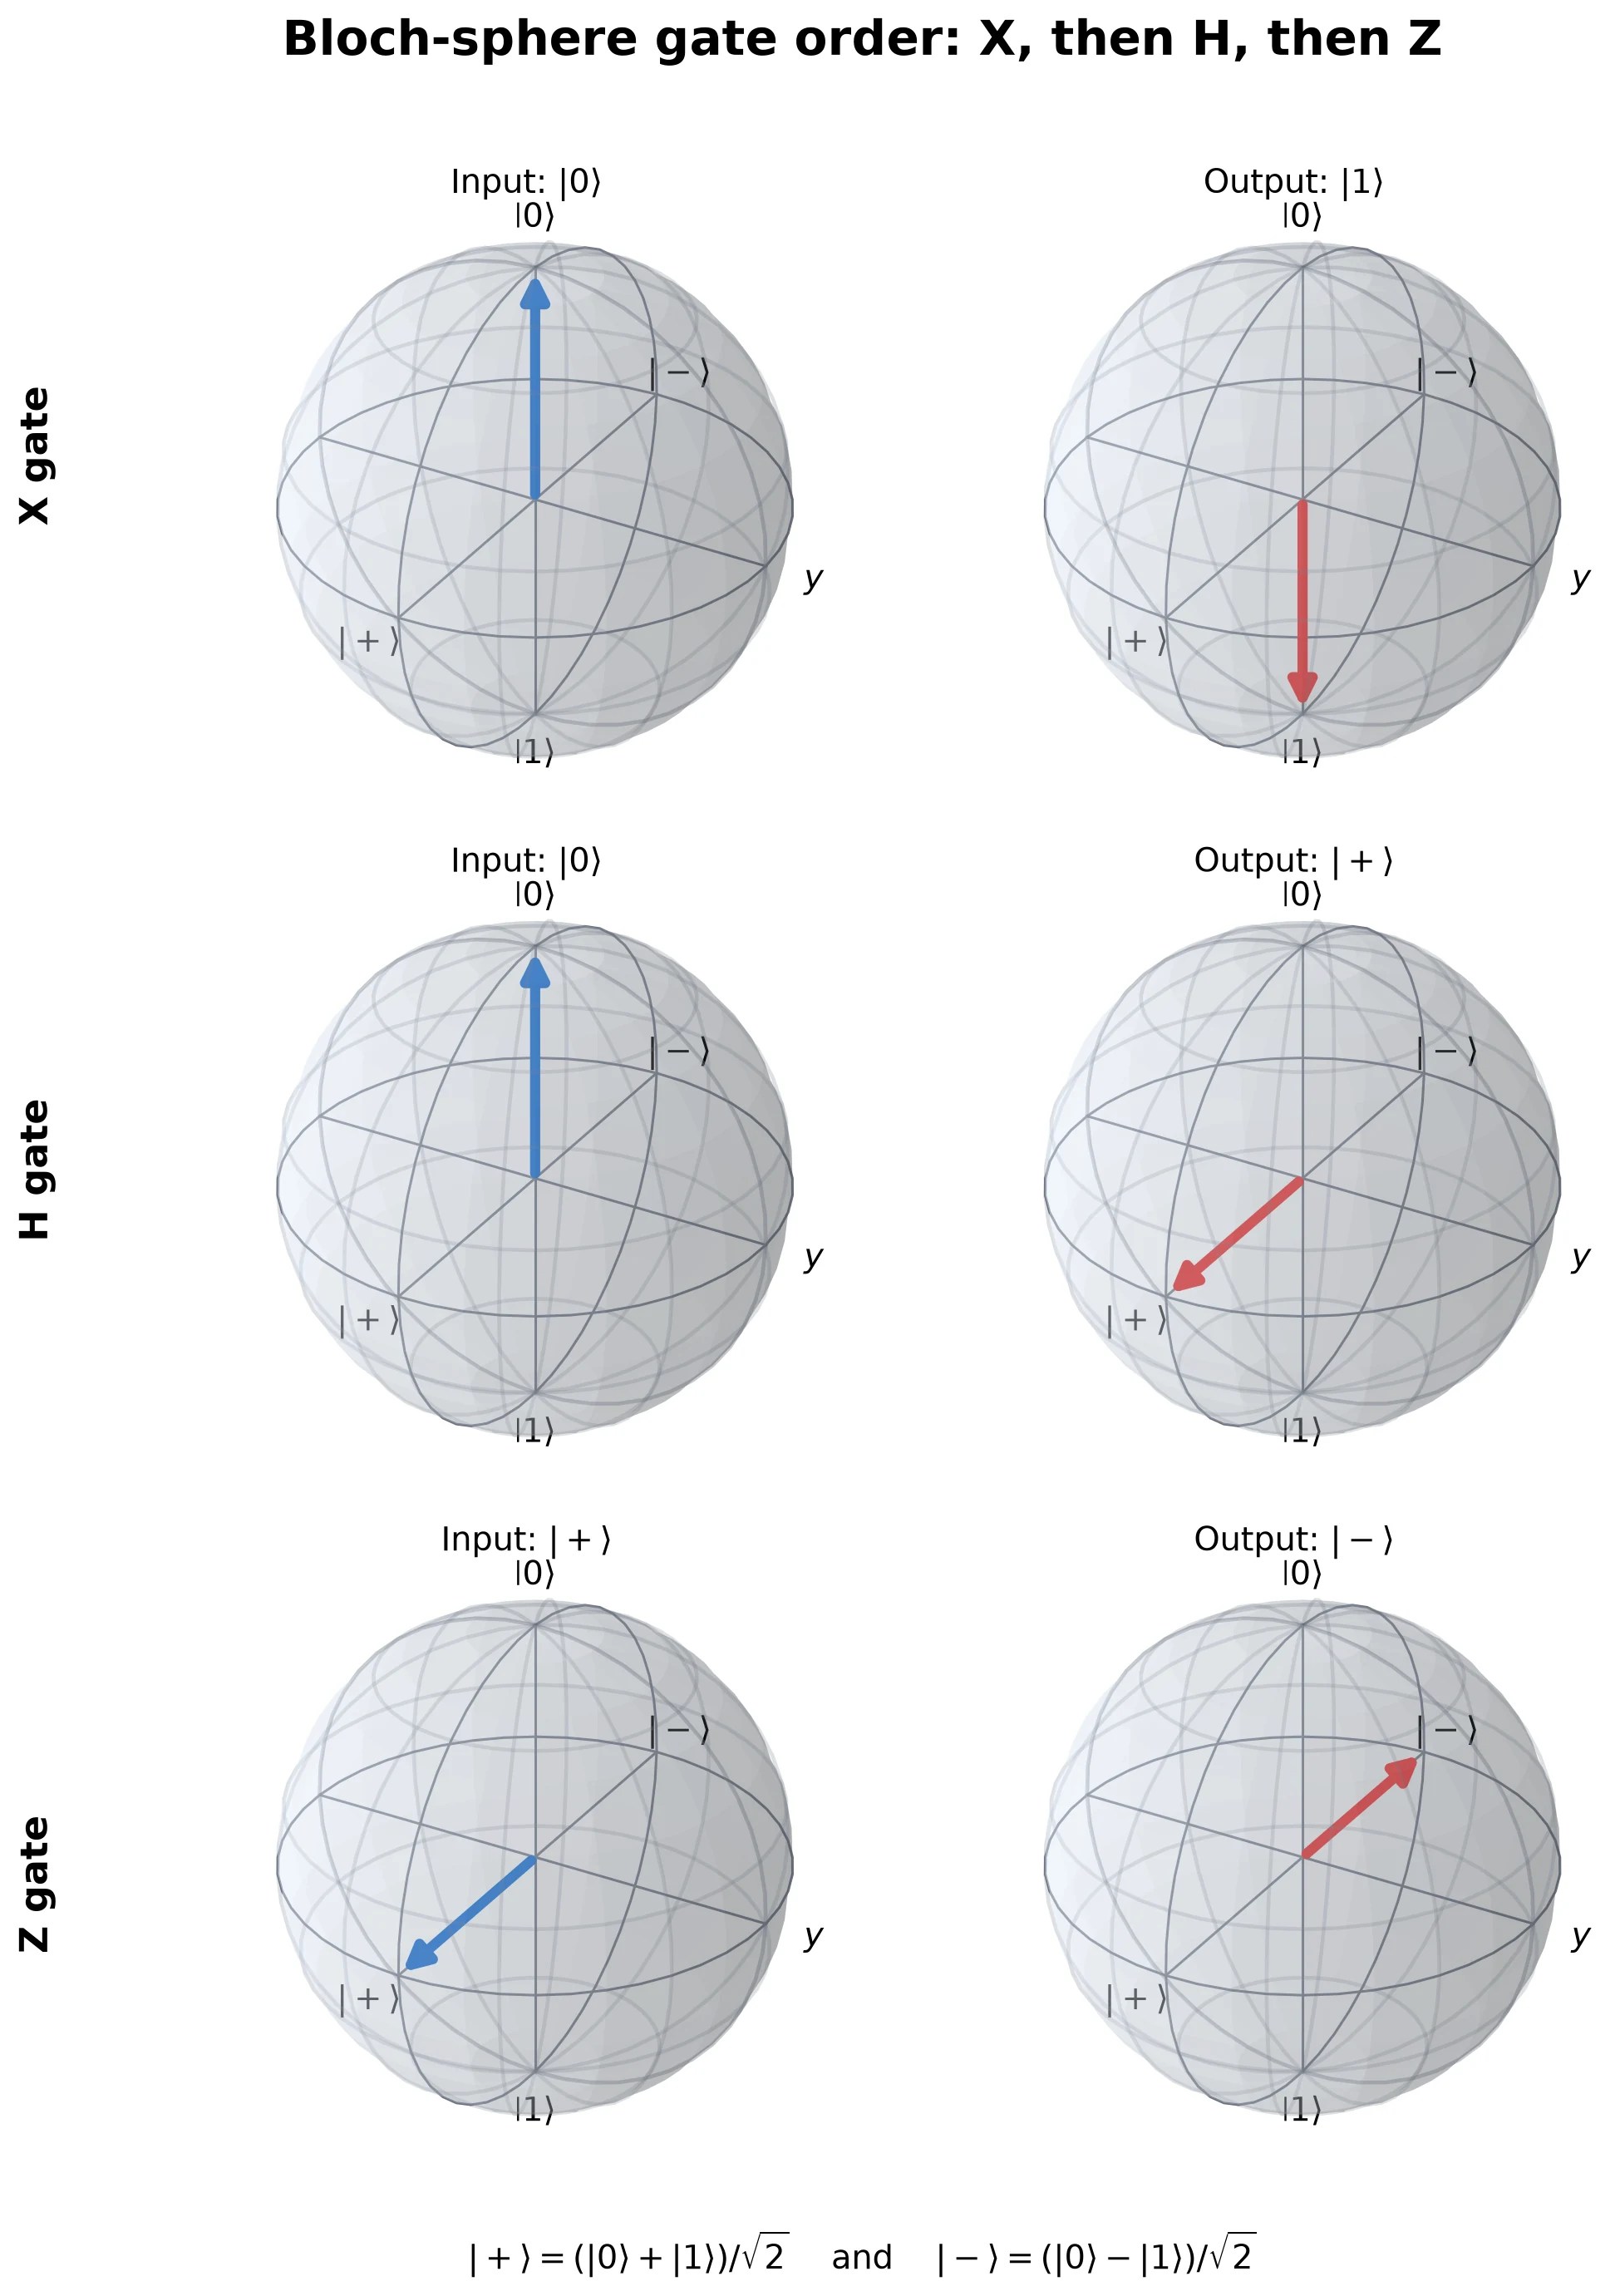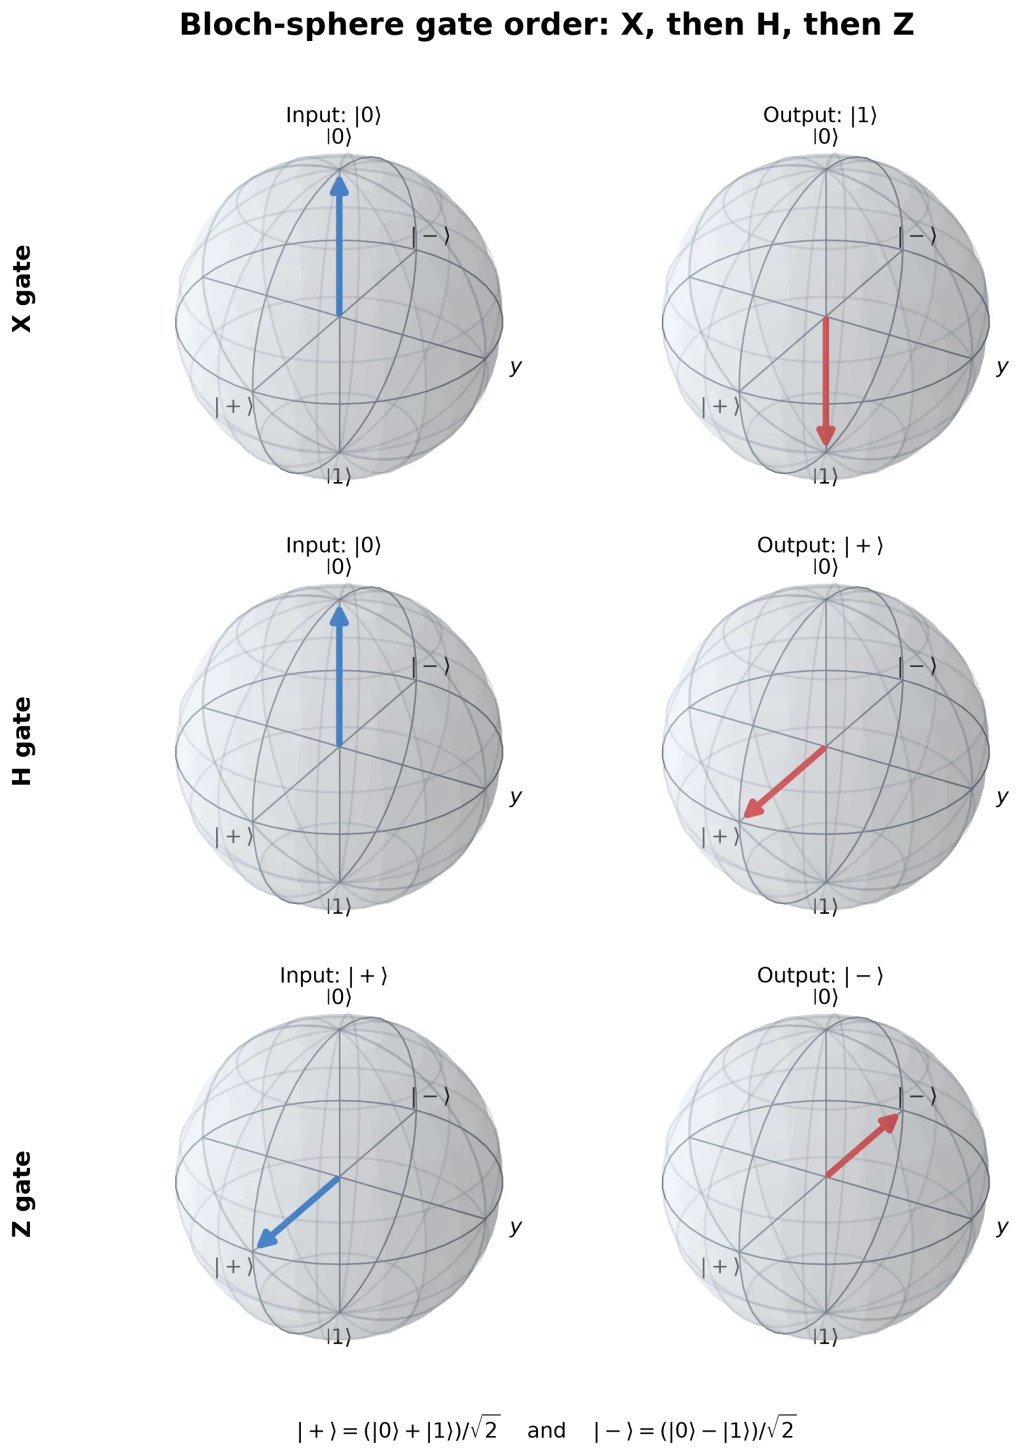
A reproducible Android workflow: calculate the states, render the spheres, compress the result, and prepare it for WordPress.
A Bloch-sphere illustration should be generated from the statevectors it claims to show. Hand-positioning arrows is quick, but it makes sign errors and axis mistakes surprisingly easy. This workflow calculates every vector first, checks the expected gate identities, and only then asks Qiskit’s Bloch renderer to draw the figure.
The normal Qiskit route is included first. A second, lean route documents the workaround used on an Android device where the full Qiskit installation could not complete within the available Termux memory. Both routes produce a publication-ready image without requiring a desktop display.

|+⟩ = (|0⟩ + |1⟩)/√2 and |−⟩ = (|0⟩ − |1⟩)/√2.1 · What Was Tested
The workflow was checked in native Android Termux with Python 3.13.13 and these installed packages:
The complete Qiskit package was not installed in the final Termux environment. Instead, the fallback loaded the unmodified qiskit.visualization.bloch.Bloch implementation from the Qiskit 2.5.2 source distribution and performed the small statevector calculations with NumPy.
2 · Install the Termux Prerequisites
Install the scientific packages from the Termux repositories. This avoids rebuilding large numerical libraries locally:
pkg update
pkg install python python-numpy matplotlib python-pillow
python -m pip show numpy matplotlib pillow
Next, try the standard Qiskit installation:
python -m pip install "qiskit[visualization]"
python -c "import qiskit; print(qiskit.__version__)"
3 · Generate the Diagram with Qiskit
Save this as generate_bloch_sphere.py. The assertions verify X, H and Z before any plotting occurs. The x-axis labels identify the two coherent superpositions explicitly.
from pathlib import Path
import matplotlib.pyplot as plt
import numpy as np
from qiskit.circuit.library import HGate, XGate, ZGate
from qiskit.quantum_info import Statevector
from qiskit.visualization.bloch import Bloch
def bloch_vector(state):
alpha, beta = state.data
overlap = np.conj(alpha) * beta
return [
float(2 * np.real(overlap)),
float(2 * np.imag(overlap)),
float(abs(alpha) ** 2 - abs(beta) ** 2),
]
zero = Statevector.from_label("0")
one = zero.evolve(XGate())
plus = zero.evolve(HGate())
minus = plus.evolve(ZGate())
assert one.equiv(Statevector.from_label("1"))
assert plus.equiv(Statevector.from_label("+"))
assert minus.equiv(Statevector.from_label("-"))
rows = [
("X gate", zero, one, r"Input: $|0\rangle$", r"Output: $|1\rangle$"),
("H gate", zero, plus, r"Input: $|0\rangle$", r"Output: $|+\rangle$"),
("Z gate", plus, minus, r"Input: $|+\rangle$", r"Output: $|-\rangle$"),
]
fig = plt.figure(figsize=(9.6, 12.6), facecolor="white")
for row_index, (gate, before, after, before_title, after_title) in enumerate(rows):
for column_index, (state, title, color) in enumerate((
(before, before_title, "#1565C0"),
(after, after_title, "#D32F2F"),
)):
axis = fig.add_subplot(
3, 2, row_index * 2 + column_index + 1,
projection="3d",
)
sphere = Bloch(fig=fig, axes=axis, font_size=13)
sphere.xlabel = [r"$|+\rangle$", r"$|-\rangle$"]
sphere.vector_color = [color]
sphere.vector_width = 4
sphere.add_vectors(bloch_vector(state))
sphere.render(title=title)
fig.text(
0.03, 0.805 - row_index * 0.31, gate,
rotation=90, va="center", ha="center",
fontweight="bold",
)
fig.suptitle(
"Bloch-sphere gate order: X, then H, then Z",
fontsize=19, fontweight="bold", y=0.995,
)
fig.text(
0.5, 0.018,
r"$|+\rangle=(|0\rangle+|1\rangle)/\sqrt{2}$"
r" and $|-\rangle=(|0\rangle-|1\rangle)/\sqrt{2}$",
ha="center", fontsize=13,
)
fig.tight_layout(rect=(0.055, 0.05, 1, 0.975), h_pad=1.4)
output = Path("bloch-sphere-x-h-z-gates.png")
fig.savefig(output, dpi=220, bbox_inches="tight", facecolor="white")
print(output)
Run it with a non-interactive Matplotlib backend:
MPLBACKEND=Agg python generate_bloch_sphere.py
4 · When Full Qiskit Will Not Install
On the tested phone, the complete Qiskit build could not finish within the available memory, and import qiskit remained unavailable. Repeatedly rebuilding the same package was not useful. The smaller solution was to download the matching source distribution and load only the official Bloch renderer.
QISKIT_VERSION=2.5.2
mkdir -p "$PREFIX/tmp/qiskit-source/extracted"
python -m pip download --no-deps --no-binary=qiskit "qiskit==$QISKIT_VERSION" -d "$PREFIX/tmp/qiskit-source"
tar -xzf "$PREFIX/tmp/qiskit-source/qiskit-$QISKIT_VERSION.tar.gz" -C "$PREFIX/tmp/qiskit-source/extracted"
The standalone bloch.py file imports one helper from qiskit.visualization.utils. Loading the file directly therefore needs a minimal module stub providing matplotlib_close_if_inline. The gate calculations remain transparent NumPy matrix multiplications.
5 · Lean Termux Fallback
The important part of the fallback is the loader below. It imports Qiskit’s Bloch class from the pinned source tree without importing the complete package:
from pathlib import Path
import importlib.util
import os
import sys
import types
import matplotlib.pyplot as plt
import numpy as np
version = "2.5.2"
root = (
Path(os.environ["PREFIX"])
/ "tmp"
/ "qiskit-source"
/ "extracted"
/ f"qiskit-{version}"
)
bloch_source = root / "qiskit" / "visualization" / "bloch.py"
def matplotlib_close_if_inline(_figure):
return None
visualization_pkg = types.ModuleType("qiskit.visualization")
visualization_pkg.__path__ = []
utils_module = types.ModuleType("qiskit.visualization.utils")
utils_module.matplotlib_close_if_inline = matplotlib_close_if_inline
sys.modules["qiskit"] = types.ModuleType("qiskit")
sys.modules["qiskit.visualization"] = visualization_pkg
sys.modules["qiskit.visualization.utils"] = utils_module
spec = importlib.util.spec_from_file_location(
"qiskit.visualization.bloch",
bloch_source,
)
module = importlib.util.module_from_spec(spec)
sys.modules[spec.name] = module
spec.loader.exec_module(module)
Bloch = module.Bloch
def bloch_vector(state):
alpha, beta = state
overlap = np.conj(alpha) * beta
return [
2 * np.real(overlap),
2 * np.imag(overlap),
abs(alpha) ** 2 - abs(beta) ** 2,
]
zero = np.array([1, 0], dtype=complex)
x_gate = np.array([[0, 1], [1, 0]], dtype=complex)
h_gate = np.array([[1, 1], [1, -1]], dtype=complex) / np.sqrt(2)
z_gate = np.array([[1, 0], [0, -1]], dtype=complex)
one = x_gate @ zero
plus = h_gate @ zero
minus = z_gate @ plus
assert np.allclose(one, [0, 1])
assert np.allclose(plus, np.array([1, 1]) / np.sqrt(2))
assert np.allclose(minus, np.array([1, -1]) / np.sqrt(2))
states = [zero, one, zero, plus, plus, minus]
titles = [
r"X input: $|0\rangle$",
r"X output: $|1\rangle$",
r"H input: $|0\rangle$",
r"H output: $|+\rangle$",
r"Z input: $|+\rangle$",
r"Z output: $|-\rangle$",
]
colors = ["#1565C0", "#D32F2F"] * 3
fig = plt.figure(figsize=(9.6, 12.6), facecolor="white")
for index, (state, title, color) in enumerate(
zip(states, titles, colors),
start=1,
):
axis = fig.add_subplot(3, 2, index, projection="3d")
sphere = Bloch(fig=fig, axes=axis, font_size=13)
sphere.xlabel = [r"$|+\rangle$", r"$|-\rangle$"]
sphere.vector_color = [color]
sphere.vector_width = 4
sphere.add_vectors(bloch_vector(state))
sphere.render(title=title)
fig.suptitle(
"Bloch-sphere gate order: X, then H, then Z",
fontsize=19, fontweight="bold", y=0.995,
)
fig.text(
0.5, 0.018,
r"$|+\rangle=(|0\rangle+|1\rangle)/\sqrt{2}$"
r" and $|-\rangle=(|0\rangle-|1\rangle)/\sqrt{2}$",
ha="center", fontsize=13,
)
fig.tight_layout(rect=(0.04, 0.05, 1, 0.975), h_pad=1.4)
fig.savefig(
"bloch-sphere-x-h-z-gates.png",
dpi=220,
bbox_inches="tight",
facecolor="white",
)
6 · Convert PNG to WebP
A high-resolution PNG is useful as a master file, but WebP is usually much smaller for the WordPress page. The tested conversion used Pillow with quality 88:
python - <<'PY'
from PIL import Image
with Image.open("bloch-sphere-x-h-z-gates.png") as image:
image.save(
"bloch-sphere-x-h-z-gates.webp",
"WEBP",
quality=88,
method=6,
)
PY
file bloch-sphere-x-h-z-gates.webp
sha256sum bloch-sphere-x-h-z-gates.webp
The exact figure used here was 1943 × 2762 pixels and the WebP file was about 180 KiB. WordPress can generate smaller display sizes while retaining the uploaded original.
7 · Add the Diagram to WordPress
- Upload the WebP file through the WordPress Media Library or the editor’s Image block.
- Write alt text that states the gate order and the transformations shown; do not use the filename as alt text.
- Use a caption to distinguish input and output colours and to expand
|+⟩and|−⟩. - Keep the image responsive with width 100% and automatic height.
- Open the saved post publicly and confirm that both the page and image return HTTP 200.
<img
src="bloch-sphere-x-h-z-gates.webp"
alt="Six Bloch spheres showing X, H and Z gate transformations"
style="width:100%;height:auto"
>
white-space:nowrap;overflow:auto, and code blocks with white-space:pre;overflow:auto.
8 · Problems Encountered and Their Fixes
| Problem | Cause | Working solution |
|---|---|---|
| Full Qiskit installation did not complete | The phone ran out of practical build memory | Use Termux NumPy/Matplotlib packages and load the pinned official Bloch source only |
Direct bloch.py import failed | One relative utility import was missing | Provide the minimal matplotlib_close_if_inline module stub before loading the file |
| Matplotlib expected a display | Termux runs without a desktop GUI | Run with MPLBACKEND=Agg and save directly to a file |
| Labels were clipped | The title and equations extended beyond the default canvas | Use a taller figure, reserve margins with tight_layout, and save with bbox_inches="tight" |
| Four or six spheres were unreadable on phones | A single wide row becomes tiny in a narrow content column | Use a portrait 3 × 2 layout and a responsive WordPress image |
| The PNG was unnecessarily large | Publication did not require lossless pixels | Keep the PNG master and publish a quality-88 WebP copy |
Frequently Asked Questions
Is the fallback still using Qiskit?
It uses the unmodified Bloch renderer from the pinned Qiskit source distribution. NumPy performs the statevector arithmetic because the complete installed Qiskit package is unavailable in that environment.
Why verify the statevectors before drawing?
A polished diagram can still be physically wrong. Assertions catch an incorrect sign, state order or gate mapping before the image is saved.
Why are |+⟩ and |−⟩ opposite even though both give 50/50 outcomes?
They have the same computational-basis probabilities but opposite relative phase: |+⟩ = (|0⟩ + |1⟩)/√2, whereas |−⟩ = (|0⟩ − |1⟩)/√2.
Should the PNG be deleted after conversion?
No. Keep it as the high-resolution master and upload the smaller WebP derivative to WordPress.
Quantum Series 2026 · Tested in native Android Termux · Diagram rendered with Qiskit 2.5.2
✦ This tutorial and its diagram were prepared with assistance from OpenAI Codex. The state transformations, Bloch coordinates, package versions and generated files were checked in the documented Termux environment. ✦
Share this:
- Share on Facebook (Opens in new window) Facebook
- Email a link to a friend (Opens in new window) Email
- Share on LinkedIn (Opens in new window) LinkedIn
- Share on Telegram (Opens in new window) Telegram
- Share on WhatsApp (Opens in new window) WhatsApp
- More
- Share on Bluesky (Opens in new window) Bluesky
- Print (Opens in new window) Print
- Share on Threads (Opens in new window) Threads
- Share on Reddit (Opens in new window) Reddit
- Share on Tumblr (Opens in new window) Tumblr
- Share on Pinterest (Opens in new window) Pinterest
- Share on X (Opens in new window) X

Leave a comment